
A Logical Basis for Cumulative Defense Strategy and the Mathematical Analysis of Defense Strategy & Countermeasures (MADSC)
- Post by: David Wallace
- November 11, 2021
- Comments off

David Wallace, Chair, ASCE/EWRI WISE SC (Water Infrastructure Security Enhancements Standards Committee), Lloyd Foster, Actuary, Computational Mathematician, Foster Colley Enterprises
View PDF
Abstract
The Water Sector has experienced an inadvertent gap in physical security by using risk models not suited for the specific needs of community water systems. Assessment results founded on the probability of adversarial threats have referenced historical frequency, likelihood, or available intelligence which has often skewed security recommendations, causing an unintended reduction in security countermeasures. This approach has also unintentionally promoted a lax culture of security in the face of emerging threats. Resiliency must be improved.
The increase of foreign and domestic threats mandates a serious evaluation of existing security methodologies, guidelines, and vulnerability assessments. A more specific and yet comprehensive defense strategy with quantitative and qualitative measurements will be presented in this informational brief to show how the Water Sector can optimize security countermeasures and achieve an objective cost to benefit ratio based on the analysis.
Design Basis Threat (DBT)
After 9/11 and the birth of the U.S. Department of Homeland Security (DHS), the fight was on to secure America’s critical infrastructure against subsequent attacks. If the U.S. could suffer an aerial attack from adversaries using our own airplanes against us, there was no telling what was possible. In the race for solutions, Design Basis Threat (DBT) was quickly adopted from the U.S. Nuclear Regulatory Commission’s 1979 DBT Rule as a methodology for protecting water, wastewater, and storm water utilities. It was not recognized at the time that the DBT methodology would contain criteria for the Water Sector that were unattainable in the way that it was for the Atomic and Nuclear Energy sectors. The result has been a vast underinvestment in security countermeasures, loss of key stakeholder trust in the accuracy of the guidelines, and an operational culture that has been disconnected from physical security priorities.
The ANSI/ASCE/EWRI 56-10, Guidelines for the Physical Security of Water Utilities, incorporated the Design Basis Threat (DBT) methodology as a guideline for securing the Water Sector, along with ASCE (2010b) which incorporated the DBT methodology for wastewater/stormwater utilities. DBT assigns a security approach to defend against a hypothetical attack by estimating the objectives and motives of a potential assailant according to the threat classifications of Vandal, Criminal, Saboteur, or Insider.1,2 The persistent problem has been the near impossibility of determining who the adversary might be, assessing their motives and objectives, and then selecting which countermeasures to use accordingly.
Risk Analysis and Management for Critical Asset Protection (RAMCAP)
The RAMCAP methodology was first introduced to Nuclear Power Plants (NPP) in 2005. In 2010 RAMCAP was published by the American Water Works Association (AWWA) with the modified name of RAM-W, adopted from Sandia Laboratories. According to the RAM-W model, risk is defined as:
Risk = Likelihood (Specific Attack) x Vulnerability (Specific Attack) x Consequence (of the Attack)3
RAM-W further states that identifying these threats is only possible with the use of “available intelligence.”3 Once again, historical frequency (likelihood) and available intelligence are critical to the success of these models.
Frequentist Probability Method and Malevolent Threats
The examination and scoring of threats, vulnerabilities, and consequences would seem reasonable, but the idea was to base threat likelihood on historical data. This worked for natural hazards, but not for malevolent attacks against the Water Sector. A statistically valid set of data simply does not exist to make this relevant. The study of historical data for determining probability is known as Frequentist Probability and has been defined in the Department of Homeland Security Risk Lexicon-2010 Edition and states in the annotation that:
“1) Within the frequentist probability interpretation, precise estimation of new or rarely occurring events, such as the probability of a catastrophic terrorist attack, is generally not possible.
2) Frequentist probabilities generally do not incorporate “degree of belief” information, such as certain types of intelligence information.” 4
Recognizing that determining the likelihood of a specific attack based on available intelligence is not possible, an innovative approach must be taken to effectively characterize adversarial risk.
Significant Developments to the Risk Equation
In 1981, the document “On the Quantitative Definition of Risk,” written by Kaplan and Garrick, proposed using “triplets” to describe risk as a set of probabilities, scenarios, and consequences.5
![]()
Kaplan and Garrick defined the risk as having three components, a scenario (si), the probability of the scenario (pi) and the consequence of the scenario (ci). With the knowledge of this criteria, the Probability of Success of a Given Threat (PS|T) could be determined.
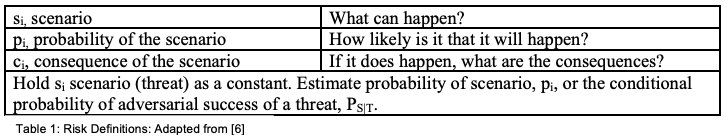
Here, the probability of the scenario could be applied to natural disasters or even man-made accidents, but estimating adversarial threats was still plagued since determining the probability of the scenario was based on historical frequency, which could not be determined.
In 2010, a document called “A Risk Informed Method for Enterprise Security (RIMES)” 6 was introduced by Sandi National Laboratories where Wyss, et al. resurfaced the Kaplan and Garrick triplets with a modification that leveraged the approach by replacing pi, the probability of the scenario, with di, the degree of difficulty. This improved the equation in determining the probability of success of a given threat for an identified scenario, degree of difficulty, and the consequence. With probability based on historical frequency removed, this puts the focus on the degree of difficulty, measuring what is known instead of trying to measure what is not known.
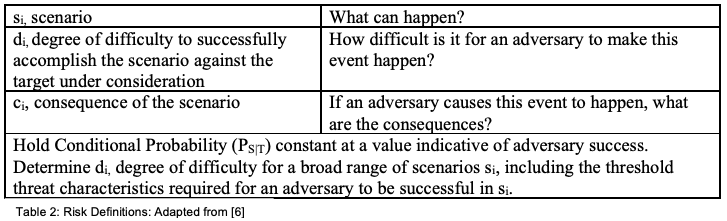
For Defense in Depth terms, if an adversary on foot were to choose a path of jumping over a fence to initiate the compromise of a targeted asset (scenario), with the intent of a catastrophic failure of a water treatment plant (consequence), then the security countermeasures required to be defeated would represent the degree of difficulty. If the triplets for security risk <si, di, ci> are known, then they become a function of the conditional probability of success of a given threat, PS|T.
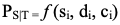
Now the question becomes how to determine what the degree of difficulty is. This measurement cannot stem from evaluating a dataset of adversarial capability as this data does not exist. And even if it did, there are an infinite number of variables that could be introduced into the equation that would significantly complicate the formula. The degree of difficulty must be measured across the security countermeasures that comprise the defensive steps an adversary must cross to reach the target. Once this is determined, the degree of vulnerability directly corresponds to the probability of success of a given threat, PS|T.
Cumulative Defense Strategy© (CDS)
With a few small adjustments, non-offensive defense strategies can be cleaned up and made more effective. The Defense in Depth methodology uses diverse protective measures along each potential adversarial path7, but this can be further defined by requiring the increase of the quality and quantity of security countermeasures throughout the scale of each defense layer. We have termed this Cumulative Defense Strategy©. Incrementally adding quality and quantity of security countermeasures throughout the defense layer increases the required resources for an adversary’s success and consequently addresses the variance in adversarial capability. This incremental increase establishes the Minimum Difficulty Threshold (MDT) level required at each step. The Cumulative Defense Strategy© method also enables a consistency of approach on which mathematical analysis can be performed to determine the probability of success of a given threat and cost/benefit analysis.
Mathematical Analysis of Defense Strategy & Countermeasures© (MADSC)
The key to unlocking the new risk definition was discovered in 2021 by Lloyd Foster and David Wallace by mathematically calculating the degree of difficulty to achieve the probability of success of a given threat for a scenario and consequence identified. The new math model analyzes the current defensive countermeasures and determines the optimized placements mathematically and objectively for improvements. The process of evaluation is called the Mathematical Analysis of Defense Strategy & Countermeasures© (MADSC), and it requires the sequential increase of quantitative and qualitative countermeasures. The MADSC analysis is performed by analyzing the defensive layers that comprise the entire defense strategy. Each defense layer addresses an attack vector. Path analysis of each attack vector is then evaluated for the number of ordinal steps and the subset of countermeasures within each of these ordinal steps. For instance, an adversary on foot may have to breach six ordinal steps to reach a critical asset, and each step consists of multiple countermeasures that collectively bolster each ordinal step. The steps are ordinal in nature because they must be sequentially crossed to reach the critical asset. At each ordinal step, the quantity of countermeasures must increase to maintain a growing Minimum Difficulty Threshold (MDT), which in turn increases the quality of each ordinal step. As referenced above, this additive nature is known as the Cumulative Defense Strategy©.
The MADSC analysis then calculates the effective difficulty of defensive countermeasures through the coupling of two different math models, which in Latin is called a “copula.” Copulas were invented in 1959 by Abe Sklar, and about a dozen formulas have been invented since then to solve unique needs. This latest version is called the Foster-Wallace Formula©. The Foster-Wallace Formula© is unique in that it couples the Probability Density Function (PDF) of a Geometric Distribution across the ordinal steps which are required to be defeated by an adversary, with the Cumulative Distribution Function (CDF) of a Gamma Distribution across the total defensive countermeasures within the subsets of the ordinal steps. This coupling provides the ability to generate the Joint Probability of compromise at each ordinal step and at each defensive countermeasure, mathematically expressed as:
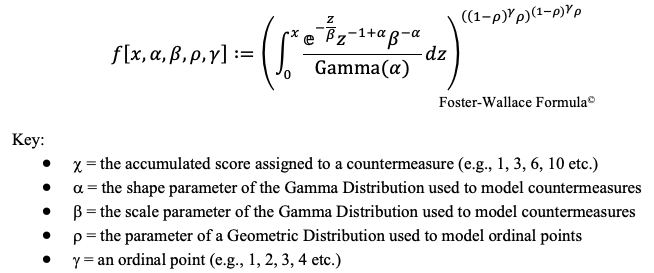
It is not necessary to understand how the formula works to understand the results of the MADSC methodology. The results are truly clear in revealing locations that are well protected and other areas that need specific improvement. In either case, a clear optimization of countermeasures is provided. Joint Probability conveys what is the probability that the entirety of countermeasures could be compromised at a given point in the breach process, specifically at a given countermeasure point within an ordinal step. It can also be used to express effective difficulty. Conversely, the percentage remaining can be used to represent the remaining difficulty required for a complete compromise of countermeasures. Therefore, the placement for the best use of investment becomes clear for guarding against compromise and achieving the highest levels of intruder delay to allow for adequate response time.
Conclusion
Unfortunately, most risk assessments currently written for the Water Sector are based on a faulty foundation of risk understanding and lead to a flawed conclusion. The risk assessment inaccuracies, due to the insufficient risk formulas, have resulted in an underinvestment of defensive countermeasures, or a reactionary over-investment from those who are aware of the problem. The more skilled risk teams who serve in the Water Sector have been aware of this problem for years but have struggled to find solutions without an adequate risk equation and formulated solution.
Utilizing the incremental increase of quantity and quality of security countermeasures and ordinal steps, evaluated with the Mathematical Analysis of Defense Strategy & Countermeasures©, and measured with the Foster-Wallace Formula©, a robust Cumulative Defense Strategy© can be implemented for optimal security countermeasure placement in the Water Sector. This new methodology will yield the most effective way of screening the various capabilities of potential adversaries with increasing difficulty levels and provides fiscally sound security practices for cost-to-benefit analysis and budgeting. The implementation of these methodologies in the Water Sector could help lead the way in physically securing other DHS critical security sectors.
References
- American Society of Civil Engineers (ASCE) (2010a). Guidelines for the Physical Security of Water Utilities, ANSI/ASCE/EWRI 56-10. pp. 3-6. ASCE, Reston, VA.
- ASCE. (2010b). Guidelines for the Physical Security of Wastewater/Stormwater Utilities, ANSI/ASCE/EWRI 57-10. pp. 67-72. ASCE, Reston, VA.
- American Water Works Association. (2013). Risk and Resilience Management of Water and Wastewater Systems, J100-10 (R13). pp. 5, 13. AWWA, Denver, CO.
- McNamara, P.A., and R. Beers. (2010). DHS Risk Lexicon 2010 Edition. pp. 16-17, 23-25. Department of Homeland Security (DHS). Washington, DC.
- Kaplan, S., and J.B. Garrick. (1981). On The Quantitative Definition of Risk, Risk Analysis, vol. 1, pp. 11-27. https://doi.org/10.1111/j.1539-6924.1981.tb01350.x
- Wyss, G.D., J.F. Clem, J.L. Darby, K. Dunphy-Guzman, J.P. Hinton, and K.W. Mitchiner. (2011). A Risk Informed Method for Enterprise Security. p. 2., Sandia National Laboratories, Albuquerque, NM.
- Sandia National Laboratories. (2016). International Training Course on the Physical Protection of Nuclear Facilities and Materials. slide 15. Albuquerque, NM. https://shareng.sandia.gov/itc/assets/08_presentation.pdf
Authors’ Bios
David Wallace has over two decades of field experience in critical security vulnerability assessments, with deployments in over 40 states including Alaska, Hawaii, the U.S. Territory of San Juan, and Canada. His education includes graduate work in Homeland Security at Penn State University and comparative homeland security studies in Israel through Homeland Security International. His site deployments have included federal law enforcement, numerous military bases, a joint operations headquarters (JOC), state and local government entities, water utilities, Department of Transportation, health care, commercial and distribution facilities, and sites of national interests. David has a strong interest in national security and advanced methodologies for securing critical infrastructure sites to protect the American way of life. His current efforts include compiling government documentation and academic research to gain a global picture of influencing factors, trends, and threats to help inform and safeguard key infrastructure.
Lloyd Foster has over 20 years of professional experience building and validating complex risk models and carries over 3 decades as a fully qualified actuary. His formal training and considerable experience include stochastic calculus, advanced statistical techniques, object- oriented programming using C++, and advanced applications in Mathematica in mathematical and statistical modeling. Lloyd also specializes in Cumulative Distribution Function, Probability Density Function, Copulas, Ordinary Differential Equations and Partial Differential Equations, with applications to security risk.